There’s Something About Treasuries. What’s going on with Treasuries? Historically, whenever the market gets spooked, it turns toward Treasuries—no matter what. Instead, while the stock market has plummeted, ripped, and re-plummeted in response to trade developments, the entire Treasury curve has shifted up. The equity market’s response is rational; it’s processing information from binary policy choices that change day-to-day. The Treasury market, however, has been weird.
The denomination ‘risk-free asset’ puts a burden of responsibility on Treasuries to keep the financial plumbing clear. We have assumed for the past 50 years that US federal government debt is the safest investment in the world and have built our financial structure on top of this assumption. So we need to ask: Why are yields moving so strangely? What would it take for the ‘risk-free asset’ to take on some degree of risk?
First, let’s look at what’s happened this week. On Monday, the entire Treasury curve shifted up. At the same time, the dollar spot index increased, so we can assume that shift was not a foreign sell off of dollar denominated assets. Some blame the unwinding of the basis trade. Hedge funds have historically used 50 to 100 times leverage to sell Treasury futures and buy the underlying securities. The current net position of this trade is estimated around $1 trillion, making hedge funds some of the largest buyers in the Treasury market. In times of turmoil, funds may need to fire sale their Treasuries to pay back their loans. If too many large holders all try to unload their long positions at once, trading and liquidity can spasm. While some positions were probably sold in a move toward cash, we managed to avoid a self-reinforcing spiral. On Tuesday and Wednesday, yields rose while the dollar fell. There are rumors that a foreign creditor government dumped some of their US Treasury Bonds (ahem China) to devalue the dollar and worsen the impact of trade wars on US consumers.
This volatility included three auctions this week in the 3-year (April 8), 10-year (April 9), and 30-year (April 10) tenors. In the last few years, the Treasury has had demand issues for the long end of the curve. Sales of $39 billion in 10 years and $22 billion in 30 years could have led asset allocators to dump their positions on Monday. Interestingly, the 3-year auction drew the weakest demand of the bunch. The next auctions had levels of demand consistent with the last few offerings. I don’t know what to make of this yet. But it’s weird.
This degree of volatility begs the question: what would it take for a US Treasury bond to be a risky asset? What changes in our financial system if they’re no longer a risk-free haven? Moving forward, I’ll be looking in depth at the long-term risks to US debt stability and the broader implications for financial market structures.
Steven R. Wagner, Associate
Steven J. Wagner, Investment Adviser
Bray Farm Income Advisory LLC
3375 Brookdale Drive, Pittsburgh PA 15241
412.504.9412
412.848.2410 (cell)
Registered Representative offering securities through Cetera Advisors LLC, member FINRA/SIPC. Advisory Services offered through Cetera Advisers LLC, a Registered Investment Adviser. Cetera is under separate ownership from any other named entity.
April Fools?! Right?! I wanted to wait to write my note until after Tuesday’s Liberation Day tariff announcements. Then I waited another two days. I don’t want to be Captain Hindsight, but the market’s surprise feels foolish. The macro models were pricing in a 5% hike in net tariff rates. The actual number was 11.5%. The Yale Budget Lab has projected1 the tariffs to drive a 2.3% increase in short-term prices, costing the average American household $3,800. These effects are only from the immediate impact of the tariffs themselves, without any geopolitical action or supply chain restructuring. After watching the stock market free fall farther than during the beginning of the pandemic, I’ve been stuck thinking about resilience. The Trump administration is correct insofar as our economy has become hyper-focused on efficiency. This need to maximize every second, mile and dollar has done wonders for corporate profit margins and the price and breadth of choice of consumer goods. Our economy for 50 years has been driven by consumptive convenience: in-demand dollar-denominated financial assets, the just-in-time supply chains, the offshoring of environmental and social accountability. Tariffs will solve none of these problems. Instead, we are careening toward a world of realpolitik-formed spheres of influence. As the global system changes in real time, we need to reflect on which of our foundational assumptions are resilient and which ones will break.
The philosophical thrust of tariffs is that US consumption can be wielded as a bludgeon. This seems true to me; Americans consume a lot. In the past few years, the American consumer has displayed an incredible resilience in the face of COVID and inflation and post-inflation recession fears. Can they keep up that incredible ability to blindly spend? How much would consumptive patterns need to change for tariffs to be less effective? I’m keeping an eye on private debt to GDP ratios. According to the New York Fed quarterly report, Q4 2024 US household debt reached a new high of $18 trillion, or around 70% of GDP. The long-term trend has been a decline in this ratio since a peak around 105% right before the Great Financial Crisis. However since COVID, the trend has flattened. Despite high interest rates, Americans have continued borrowing.
I find the arguments minimizing the economic impact of tariffs deeply unsettling for one reason: we have not had serious implementation of protectionist policies in a time with deeply interconnected global supply chains. The complexity of production, transportation, and consumption has grown in orders of magnitude in recent decades. Let’s leave the tangled web of intermediacy that goes into sophisticated technology like cars or smartphones.
Steven J. Wagner, Investment Adviser
Bray Farm Income Advisory LLC
3375 Brookdale Drive, Pittsburgh PA 15241
412.504.9412
412.848.2410 (cell)
Registered Representative offering securities through Cetera Advisors LLC, member FINRA/SIPC. Advisory Services offered through Cetera Advisers LLC, a Registered Investment Adviser. Cetera is under separate ownership from any other named entity.
The views stated in this letter are not necessarily the opinion of Cetera Advisors LLC. Due to volatility within the markets mentioned, opinions are subject to change without notice. Information is based on sources believed to be reliable; however, their accuracy or completeness cannot be guaranteed. Past performance does not guarantee future results.
Notes from the week We were able to attend the Exchange Conference this past week. The ETF-focused gathering was an opportunity for us to run due diligence on
asset managers collected in one location. I had two big takeaways from the event. 1.) The best products are made by people who directly solve simple problems. These teams identify something missing from the market that people want anyways and fill the void. The least convincing pitches are “WOW this thing in the market is really good right now, why not make it even GOODER in an ETF?!”. 2.) Income-focused funds are an important contributor to future returns. While this category includes bonds and fixed income, this is not all about bonds and fixed income. We heard a lot of pitches on income-producing option strategies overlaid on an underlying basket of equity products. We’re intrigued by the idea but have not been sold yet. We need to understand how the creation/redemption process interacts with the capacity to write covered calls. If shares of an ETF are redeemed and securities are returned to a market maker, how does that affect the extent pool of options? However, the biggest movement in the ETF space is the rise of actively managed funds. The early ETFs were focused on passive strategies pegged to indices. This works well for equities, which has a limited number of options –there are about 4,300 public companies in the US. Income faces more market fragmentation – there are about 80,000 active bonds in the US. Active management can be advantageous in this field as managers need to parse through multiple issues from individual issuers, changes in underlying interest rates, differentiating between collateralizations, and evaluating tactical opportunities. We believe, with our long experience in credit and fixed income, Bray Farm IA is well positioned to take advantage of this trend.
On the macro side… Today we had a release of the February results for the Personal Consumption Expenditures (PCE), the Fed’s favorite measure of prices. The number came in a little hotter than expected with a year-over-year core increase of 2.8%.
And this is before tariffs…. However, rather than driving bond yields higher, we saw yields drop, especially in the belly of the curve (5-10 years). The short term – less than one year – is still anchored by the Fed’s holding power. In the near term – 2 to 5 years – the focus is marginally on a slowing of growth rather than a change in prices. In the belly of the curve, the focus is really on growth. In a strange contradiction, a hot inflation reading makes the bond market less worried about inflationary pressure and more worried about growth. I think it’s a fair bet to assume that the Fed would deal with growth issues first. An important side note—much of the discussion from Treasury Secretary Bessent is around the 10-year yield. At some point, we should listen and accept the administration may take regulatory action to make this happen. The big options on the table are limiting auction sizes and changing capital requirements on banks.
Steven J. Wagner, Investment Adviser
Bray Farm Income Advisory LLC
3375 Brookdale Drive, Pittsburgh PA 15241
412.504.9412
412.848.2410 (cell)
Registered Representative offering securities through Cetera Advisors LLC, member FINRA/SIPC. Advisory Services offered through Cetera Investment Advisers LLC, a Registered Investment Adviser. Cetera is under separate ownership from any other named entity.
The views stated in this letter are not necessarily the opinion of Cetera Advisors LLC. Due to volatility within the markets mentioned, opinions are subject to change without notice. Information is based on sources believed to be reliable; however, their accuracy or completeness cannot be guaranteed. Past performance does not guarantee future results.
Exchange-traded funds are sold only by prospectus. Please consider the investment objectives, risks, charges and expenses carefully before investing. The prospectus contains this and other information about the investment company, can be obtained from your financial professional at 412.504.9412. Be sure to read the prospectus carefully before deciding whether to invest.
Private markets are a growing interest for the institutional and individual investor. Institutional investors, who have long been attracted to the strong earnings of private equity, need to follow the trends in relationships between the fund-investing Limited Partners (LPs) and the managing General Partners (GPs) to access the whole class of alternative investments. While private markets have long been restricted to institutions and accredited investors, the large alternative managers have begun finding ways to market private assets to individual investors through ETFs and, in the future, the introduction of private assets into 401Ks. Individual investors should be literate in private market developments to help determine if these investments are an appropriate choice for their portfolio.
Private equity has been the golden child of capital markets in the decade after the Great Financial Crisis (GFC)i. High, safe returns have attracted floods of Limited Partner capital from cash-heavy pension funds, insurers, and family offices. The number of fundsii continues to grow and accelerate as sponsoring firms are able to recoup strong fees and tax-incentivizediii compensation. A post-pandemic boom drove the industry to recordsiv in deal volume and transaction value ($2.2 trillion), as buyout firms benefited from easy access to cheap debt and a wealth of exit opportunities from cash heavy buyers. The industry, however, fell victim to the inflation and rate hikes of 2022 and 2023; traditional exit opportunities through Initial Public Offerings (IPOs) or trade sales jammed upv against rising interest rates and uncertainty.
In a down market, GPs have reverted to value growth through operational management and margin expansionvi rather than market-driven multiple expansion. Organic growth is harder to come by so funds have extended holding periods—up to 3 yearsvii over historical periods. The other option is a 3rd way of exits: a wave of financial innovation. As the lifespan on funds continues to grow, LPs are demanding their cash back before committing to follow up fundsviii. To hold on to promising cash-producing holdings while returning cash to liquidity-concerned investors, funds have turned to novel mechanisms like continuation funds, net asset value (NAV) loans/ subscription line credit, and the secondary market.
Enter the Minsky Instability Hypothesis.
Formalized by Hyman Minsky and extended by Steve Keenix, the Minsky cycle provides a framework for understanding the growth and decay of modern financial economies. The first step is growth. Initially, financialized assets with strong cash flows attract investment. As these assets appreciate, rising valuations encourage more investors to enter the market, fueling further price increases. Easy enough. Then, as asset prices continue to see sustainable growth, firms—rationally—begin borrowing against these assets to maximize returns. Over time, rational borrowing shifts to speculative excess. Participants begin to value assets based on resale potential rather than intrinsic cash flow generation; leverage becomes self-reinforcing—borrowers rely on rising prices to justify additional debt. Eventually, some investors appropriately value risk and begin selling, but the market doesn’t recognize the underlying fragility. As soon as asset prices stagnate or decline, over-leveraged investors face margin calls and issues with debt service, forcing them to sell at a discount. This dynamic amplifies the downturn, triggering a broader market collapse.
Inflation plays a critical role in potentially extending the duration of the cycle. If the market crests during an inflationary environment, the underlying assets may still report strong nominal cashflows. By leveraging these inflated valuations, firms can use financial engineering and debt restructuring to prolong asset holding periods, rather than facing realized losses in the open market.
Sound familiar? The growing use of continuation funds, NAV financingx, and secondary markets reflects an industry-wide attempt to buy time against an interest rate-driven constriction of the exit market. Faced with limited traditional exits, funds are engineering boosted returns and synthetic liquidity for LPsxi, hoping that future market conditions will improve.
This optimism is rational for individual actors, as each GP seeks to maximize its fund’s performance and may have strong performing underlying assets. However, in aggregate, levered optimism introduces structural weaknesses into private markets. Valuations remain artificially high, leverage deepens through all levels of the fund structure, and liquidity mismatches grow.
In Minsky’s terms, private markets are in the space between rational financing and speculative excess, where price discovery is replaced by financial engineering. The opaque nature of private markets obscures these risks, making it difficult to assess how deep these structural weaknesses run. To understand whether these mechanisms prevent a large correction or delay the inevitable, we must examine the nature of these techniques and their contributions to valuation trends, secondary market pricing, and the liquidity profile of the market.
Since 2022, continuation funds have surged in popularity.
The idea is simplexii: a fund’s sponsoring firm creates a new fund, raises money for the continuation fund, and buys portfolio companies from the original fund. LPs of the original fund are given the option to roll their investments into the continuation fund or to take their share of the proceeds from the transfer process.
The modern use of continuation funds has a compelling casexiii, despite early concerns about ‘zombie funds’xiv and the use of continuation funds to shelter tail-end assetsxv. Now, GPs tend to selectively transfer over their highest performing holdings. Historically, this positive selection has led to comparable returns to buyout funds with less volatility. The transfer process also mitigates blind pool risk: LPs have more information on their investment’s holdings before deciding whether to roll over or divest.
Faced with limited exit opportunities, the market has increasingly turned to continuation funds as an alternative liquidity solution, even as concerns over valuation transparency persist. The past two years have seen a record number of continuation funds closing with 65 in 2024, beating the previous record of 57 in 2023. In the first half of 2024, continuation funds made up 86% of GP-led activityxvi in the secondary market. Particularly, the use of single-asset continuation vehicles (SACVs) has boomed, between 2021 and 2023. SACV volume topped $70 billion, over triple the previous three years. In 2024, SACVs accounted for over half of continuation fund activity.
While continuation funds provide GPs a method to avoid selling premier assets at a loss, they can introduce structural frictionxvii into the GP-LP relationship. The first concern is the valuation of the underlying assets in the transfer between the original fund and its continuation vehicle. Since the same sponsoring firm represents both sides of a continuation transaction, fund managers have oversized weight in the price-discovery process.
Moreover, GPs have an incentive and an abilityxviii to set the price that is most favorable to themselves, especially in an environment where inflation has nominally supported valuations. Rising price levels can mask underlying stagnation, allowing firms to justify higher NAVs based on price-driven revenue growth rather than fundamental cash flow strength. By setting their own prices, GPs not only report stronger IRRs to attract secondary investors but also mitigate markdown risks that could trigger broader valuation concerns.
This effect is amplified as continuation funds become a dominant liquidity mechanism in an exit-limited economy.
This pricing ecosystem sustains higher NAVs across the private equity market, potentially delaying necessary corrections. This impact is less pronounced when LPs roll over their investments, as they continue benefiting from the same pricing dynamics as their GPs. However, in the last few liquidity-strapped years, 80-90% of LPsxix have opted to cash out rather than reinvest, requiring GPs to bring in new buyers—further reinforcing the incentive to set valuations at optimistic levels. These factors and macroeconomic conditions exacerbate informational asymmetry in private equity markets, where market-clearing prices remain obscured by internal transactions rather than external price discovery.
In addition to the continuation mechanism, funds have adapted to a weakened transaction market through the expansion of leverage.
Traditionally, buy-out funds have siloed debt between individual portfolio companies; one asset defaulting does not affect the credit of the rest of the portfolio. However, increasingly private equity has turned toward fund level finance to manage liquidity during a down market or to improve the performance metrics of its portfolio. The two primary fund-level tools—subscription line credit and net asset value loans—serve different functions at different stages of a fund’s life cycle. Both introduce leverage risks in the hope of improved future pricing for the underlying assets.
Subscription line credits (SLC) are a debt structurexx that allows funds to borrow against their LPs’ outstanding capital commitments. Since the value of these capital commitments decreases over a fund’s lifespan, SLCs are primarily used early in a fund’s life. The use of SLCs has become increasingly popular in PE’s Zero Interest Rate Period-era boomxxi. In 2010, less than 5% of all funds used SLCs, in 2024 around 35%; in 2010 10% of one-year old funds used them, in 2024 more than 75% had SLCs.
The nominal goal of this debt is generally to support portfolio companies during the gap between portfolio investments and the drawdown of capital commitments. However, funds have leaned on this debt to provide synthetically increased returns through cash flow-derived metrics and early returns of capital. Fund sponsors levered with SLCsxxii call their capital later and less frequently. Internal metrics can be manipulated by SLC use; annualized IRR increases by 1.9 percentage points—12.6% over the standard deviation; the public market equivalent increase by 0.03—11.3% increase over the sample. The timing of adding on leverage is dependent on a fund’s fundraising and fee structure. GPs are 21% more likely to use an SLC in the 12 quarters before follow-on fundraising and 12% more likely in the period before reaching the hurdle rate. Most notably, GPs with public pension LPs—who may have weaker governance control than family offices or insurance companies—are significantly more likely to lean on fund-level finance before fundraising.
Early-stage fund financing can help manage investor expectations, but it prioritizes fundraising optics over organic growth.
Since SLCs rely on LP commitments that decline over time, NAV loans emerge as a funding alternative later in a fund’s lifecycle. These loansxxiii are backed by the underlying value of the fund’s portfolio and cashflow, which grow and peak into a fund’s harvesting stage. The market for NAV loans has surgedxxiv, growing at 30% annually since 2019. The market, now at $100B in outstanding loans, is expected to hit $600 billion by 2030, driven by private credit expansion and increased adoption. Due to the lack of transparency in private markets, aggregated information on the market is reliant on self-reported survey information from lendersxxv. Most financing agreements have conservative loan-to-value relationships between 10% and 20%; though a not insignificant portion (16%) of the loan market has LTVs greater than 20%.
Funds may use leverage to accelerate distributions, finance add-on investments, or manage expenses. The market has priced NAV loans cheaperxxvi than direct company-level debt, assuming a more diversified pool of assets disperses risk. However, this assumption may be misleading. The low cost of NAV loans—especially in a high-interest rate environment—can encourage fund managers to add unnecessary leverage on a new level of the capital structurexxvii.
The double-edged sword of NAV financing’s more diverse set of underlying assets is the risks associated with cross-collateralization. Unlike traditional PE portfolio debt, where each company’s obligations are siloed, NAV loans tie multiple assets together as collateral, meaning distress in one company impacts the entire fund. If a single asset loses value or faces liquidity stress, the lender may require additional collateral across multiple companies, amplifying contagion effects.
Moreover, NAV-based financing relies on accurate portfolio valuation—but inflation can allow NAV loans to be collateralized against asset prices supported by price level-driven revenue. This cycle can create a liquidity trap where GPs, instead of exiting assets at depreciated values, use additional borrowing to maintain portfolio valuations, worsening systemic fragility and pushing it into the future.
The rapid expansion of fund-level finance is not happening in isolation—it is deeply tied to the surge in private credit markets, which in turn rely on collateralized loan obligations (CLOs) as a key liquidity provider. In the same period of booming growth in NAV financing, private credit issuance has balloonedxxviii from $1 trillion in 2020 to $1.5 trillion in 2024 and projected to reach almost $3 trillion by 2029. The derisking of bank balance sheetsxxix have left an open gap for private credit funds to supply a growing demand for fund finance.
Concurrently, CLOs have seen a record year in issuancexxx with an increasing share of private credit CLOs. By securitizing these loans, CLOs can link private equity and its fund level finance to private credit to the broader institutional debt markets. If credit markets tighten, the flows might run in the other direction, and GPs relying on NAV loans may struggle to refinance, triggering forced sales of portfolio assets at discounted prices.
While NAV loans offer flexibility and may be a good option for some funds, their rapid growth suggests a dependency on fund-level leverage rather than organic performance. For NAV loans to remain a healthy part of private equity’s financing toolkit, greater transparency in asset valuations and risk pricing is essential to avoid potential liquidity challenges.
The private equity industry sits at a crossroads, navigating a fragile balance between financial engineeringxxxi and real economic fundamentalsxxxii. As fund managers increasingly rely on continuation vehicles and fund-level lending to sustain valuations, we need to ask ourselves: is this a necessary adaptation to survive a downturn or the buildup of systemic risk?
In the most optimistic scenario, private equity’s long-term bullishness is well-founded. A business-friendly administration, continued strength from macro indicators, and healthy financing options lead to a revival of M&A activity and IPO markets. With traditional exit routes cleared, GPs can offload assets at strong multiples, justifying the extended holding periods enabled by financial engineering. The secondary market continues to provide liquidity solutions without distorting the accuracy of valuations, and private credit maintains stability. Private equity smooths prices through a downturn in the business cycle with minimal structural damage.
In the worst case, private equity has deferred their reckoning. Prolonged duration on assets through synthetic liquidity and leverage is like water building up behind a paper dam. A credit crunch, macroeconomic instability, sticky inflation, and elevated long-term interest rates could all undermine the industry’s assumptions about sustained growth, mispriced nominal cash flows, and stable exit opportunities. If a liquidity squeeze forces widespread asset sales, funds relying on NAV loans and continuation funds may face sudden markdowns, triggering a self-fulfilling cycle of declining valuations, forced equity injections, and fire sales.
The systemic risk could be further amplified by the link between private equity, private credit, and institutional debt markets. CLOs—major buyers of leveraged loans issued by private credit funds—are increasingly likely to receive favorable regulatory treatmentxxxiii under Basel III. If AAA-rated CLO tranches are mispriced and overleveraged—and the tranches are affected by declining valuations of the second-order underlying assets—we may see a cascading effect into the banking sector.
Large, well-capitalized funds may be able to weather the storm, but mid-market PE firms—who disproportionately rely on fund-level financingxxxiv—would be the first casualties.
Ultimately, however, financial engineering is not inherently a sign of weakness—it can be a rational response to illiquid markets, changing macro conditions, and pressure from investors. But if these tools obscure legitimate risks rather than manage them, private equity may be setting itself up for a harsher reckoning in the future. Opacity has long been a hallmark of private markets, but as financial engineering expands, so does systemic risk. Without standardized valuation methods, greater transparency on fund-level leverage, and regulatory oversight of private credit-macroeconomic linkages, the market may be sleepwalking into its next crisis.
Addendum: Another great resource is a paper by Elham Saeidinezhad ,“Banks as Synthetic Hedge Funds”, which discusses SLCs from a bank’s perspective. A part of her argument is that underpriced SLCs allow banks to act as synthetic LPs in private markets.
Definitions
Limited Partnership— A legal partnership between General Partners, who are responsible for managing the business, and Limited Partners, who have no rights in managing the business but in return have limited liability for debts and legal obligations. Most private equity funds are structured as Limited Partnerships.
General Partnership— A legal partnership in which all partners equally share management responsibility and liabilities.
Net Asset Value (NAV) Loans— A loan to a private equity fund itself—rather than its portfolio companies— which is secured by the value of the fund’s investments.
Collateralized Loan Obligation (CLO)— A CLO is a securitized pool of leveraged loans. Investors buy tranches, with risk and return determined by their priority in the payment structure. The safest tranche (AAA-rated) is paid first but earns the lowest yield, while the riskiest (equity tranche) is paid last and earns the highest potential returns.
Disclosures: All investing involves risk, including the loss of principal. The stated views in this commentary are not necessarily the opinion of Cetera Advisors LLC. Due to volatility within the markets mentioned, opinions are subject to change without notice. Information is based on sources believed to be reliable; however, their accuracy or completeness cannot be guaranteed. Past performance does not guarantee future results. Limited partnerships are subject to special risks and individuals must meet specific suitability standards before investing. This is neither an offer to sell nor a solicitation of an offer to buy any security. Such an offer is made by a prospectus only. Prospectuses will be available. Please read it carefully before investing or sending money. Risks include: -May not be suitable for all investors -Redemption may be at more or less than the original amount invested -There is no assurance that the stated investment objectives will be met.
Steven J Wagner, Investment Adviser
Bray Farm Income Advisory, LLC
3375 Brookdale Dr
Pittsburgh PA 15241
412.504.9412
412.848.2410 (cell)
Registered Representative offering securities through Cetera Advisors LLC, member FINRA/SIPC. Advisory Services offered through Cetera Advisers LLC, a Registered Investment Adviser. Cetera is under separate ownership from any other named entity.
i Nesbitt, S. L. (2024, April 23). Long-Term Private Equity Performance: 2000 to 2023. Retrieved from CAIA: https://caia.org/blog/2024/04/23/long-term-private-equity-performance-2000-2023
ii Preqin Headcount Preqin. (2019, March 17). Private Equity Firms Continue to Add to Headcount. Retrieved from Preqin: https://www.preqin.com/insights/research/blogs/private-equity-firms-continue-to-add-to-headcount
iii Tax Policy Center. (2024, January). What is carried interest, and how is it taxed? Retrieved from https://taxpolicycenter.org/briefing-book/what-carried-interest-and-should-it-be-taxed-capital-gain
iv Cohen, S. A., Cain, K. L., & Harish, A. B. (2022, February 9). Private Equity: 2021 Year in Review and 2022 Outlook. Retrieved from Harvard Law School Forum on Corporate Governance: https://corpgov.law.harvard.edu/2022/02/09/private-equity-2021-year-in-review-and-2022-outlook/#:~:text=2021%20continued%20the%20sharp%20upward,and%20%24146%20billion%20in%202019.
v Thomas, D., & Sabater, A. (2024, July 17). Private equity exits pacing for 5-year low after slow H1. Retrieved from S&P Global Market Intelligence: https://www.spglobal.com/market-intelligence/en/news-insights/articles/2024/7/private-equity-exits-pacing-for-5-year-low-after-slow-h1-82435868
vi Halftermeyer, M., & Odeh, L. (2024, September 25). Private Equity Calls in Experts to Fix Firms They Can’t Sell. Retrieved from Bloomberg: https://www.bloomberg.com/news/articles/2024-09-25/private-equity-calls-in-experts-to-fix-companies-they-can-t-sell
vii Walsh, B., Morris, J., Dutterer, T., & Pais, L. (2024, May 08). How the drivers of private equity value creation are changing. Retrieved from EY: https://www.ey.com/en_gl/insights/strategy-transactions/how-the-drivers-of-private-equity-value-creation-are-changing
viii Tunick, B. (2024, January 9). This Year, Expect LPs to Dial up the Pressure for Capital Returns. Retrieved from Middle Market Growth: https://middlemarketgrowth.org/lp-capital-equity-returns-gp/
ix Keen, S. (1995). Finance and economic breakdown: modeling Minsky’s “financial instability hypothesis”. Journal of Post Keynesian Economics, 607-635.
x Sindreu, J. (2024, November 29). Private-Equity Funds Are Taking Out Loans They Don’t Really Need. Retrieved from Wall Street Journal: https://www.wsj.com/finance/investing/private-equity-funds-are-taking-out-loans-they-dont-really-need-3a390290
xi Ruckin, C., Ramnarayan, A., & Amodeo, J. (2025, January 21). Private Equity Has a Plan If IPOs Don’t Work:
Add Debt. Retrieved from Bloomberg: https://www.bloomberg.com/news/articles/2025-01-
21/private-equity-has-a-plan-if-ipos-sales-don-t-work-more-debt
xii Forestner, M., & Young, B. (2022, February 26). Continuation funds: Gifts that keep on giving. Retrieved from
Mercer: https://www.mercer.com/insights/yield-point/continuation-funds-gifts-that-keep-on-
giving/#:~:text=Continuation%20funds%20involve%20an%20entity,fund%20approaches%20its%20
natural%20conclusion.
xiii Handal, V., Li, L., & Ritsko, N. (2024, September 25). Research Validates Growing Adoption of Continuation
Transactions. Retrieved from HarbourVest: https://www.harbourvest.com/insights-
news/insights/research-validates-growing-adoption-of-continuation-transactions/
xiv Le, A. (2023, December 26). Continuation funds continue their streak: Story of the Year. Retrieved from
Private Equity International: https://www.privateequityinternational.com/continuation-funds-
continue-their-streak-story-of-the-year/
xv Kirkland & Ellis. (2022). Spotlight on Continuation Funds. Retrieved from https://www.kirkland.com/-
/media/content/bring-down/kirkland2/fundsfeb2022.pdf
xvi Handal, V., Li, L., & Ritsko, N. (2024, September 25). Research Validates Growing Adoption of Continuation
Transactions. Retrieved from HarbourVest: https://www.harbourvest.com/insights-
news/insights/research-validates-growing-adoption-of-continuation-transactions/
xvii Kastiel, K., & Nili, Y. (2024, January). The Rise of Private Equity Continuation Funds. Retrieved from Chicaco
Booth School: https://www.chicagobooth.edu/research/stigler/research/-
/media/5d46328c68e0466b9787f42d98275f3b.ashx
xviii Lee, N., & Dawkins, D. (2024, December 4). Three takeaways on private equity valuations: what fair value
adjustments reveal. Retrieved from Preqin: https://www.preqin.com/insights/research/blogs/three-
takeaways-on-private-equity-valuations-what-fair-value-adjustments-reveal
xix McElhaney, A. (2023, June 13). As Continuation Funds Plague LPs, Investors Search for a Solution.
Retrieved from Institutional Investor:
https://www.institutionalinvestor.com/article/2bsts917gtgnemdxpunls/portfolio/as-continuation-
funds-plague-lps-investors-search-for-a-
solution#:~:text=These%20vehicles%20purportedly%20allow%20a,or%20a%20lack%20of%20trans
parency.
xx Baker, C. M. (2024). Net Asset Value Financing and Private Equity. Retrieved from Penn Law Review :
https://pennlawreview.com/2024/05/24/net-asset-value-financing-and-private-equit
xxi Warren, P. (2023, July 11). The Rise (and Rise) of Sub Lines in Private Credit. Retrieved from MSCI:
https://www.msci.com/www/blog-posts/the-rise-and-rise-of-sub-lines/04219806963
xxii Albertus, J. F., & Denes, M. (2024, November 06). Private Equity Fund Debt: Agency Costs and Cash Flow
Management. Retrieved from SSRN: https://papers.ssrn.com/sol3/papers.cfm?abstract_id=3410076
xxiii See Baker (2024)
xxiv See Sindreu (2024)
xxv Bippart, G. (2024, December 10). New NAV loan index offers some surprising insights. Retrieved from
Private Funds CFO: https://www.privatefundscfo.com/new-nav-loan-index-offers-some-surprising-
insights/
xxvi Rede Partners. (2024, June). NAVigating NAV Financing. Retrieved from
https://static1.squarespace.com/static/64490f0ae7870656fbebb50f/t/6697c407201bcb756e6c2a84
/1721222155944/Rede_Partners_NAV_Report_2024.pdf
xxvii See Baker (2024)
xxviii Miller, D. (2024, December 18). 2025 Private Credit Outlook. Retrieved from Morgan Stanley:
https://www.morganstanley.com/im/en-us/individual-investor/insights/articles/private-credit-
outlook-2025-opportunity-growth.html
xxix Morrison, S. (2024, March 13). Fund finance: Evolution, insights, and opportunities. Retrieved from
Aberdeen Investments: https://www.abrdn.com/en-us/institutional/insights-and-research/fund-
finance-evolution-insights-and-opportunities-us
xxx Pereira, H. (2024, December 3). CLO Issuance Sets Annual Record, Poised for Busy 2025. Retrieved from
LSTA: https://www.lsta.org/news-resources/clo-issuance-sets-annual-record-poised-for-busy-2025/
xxxi Benitez, L., & Brown, S. (2023, September 26). Private Equity Is Piling Debt on Itself Like Never Before.
Retrieved from Bloomberg: https://www.bloomberg.com/news/articles/2023-09-26/private-equity-
is-piling-debt-on-itself-like-never-before
xxxii See Halftermeyer & Odeh (2024)
xxxiii Hintze, J. (2023, September 29). Amid Controversy over Capital Requirements, Top-Rated Structured
Bonds Offer Respite. Retrieved from GARP: https://www.garp.org/risk-intelligence/credit/amid-
controversy-capital-092923?utm_source=chatgpt.com
xxxiv Lazard. (2025, January 23). 2024 Secondary Market Report. Retrieved from
https://www.lazard.com/research-insights/lazard-2024-secondary-market-report/
Rolling fields, rolling hills, rolling stone, rolling in the dough. And now, rolling recession? As we continue to assess macroeconomic uncertainty and whether a soft (or not so soft) landing is on the way, the term “rolling recession” has been introduced as a plausible explanation as to why the U.S. economy has continued to march forward in the face of supply chain disruption, restrictive Fed policy, and the signaling inverted yield curve. In short, we may have already seen the recession even though the NBER can’t define one. I’m not sure about our readers, but I can’t seem to ever recall discussing, analyzing, or assessing the implications of a rolling recession whether in academic life or financial markets experience. Perhaps I missed that session in class. And now that I think about it, I can’t recall the lessons learned from “Forecasting Financial Conditions following a Global Pandemic” from back in the day either.
Rolling right along, last week the Fed announced no change to its policy rate and reiterated its objective to reduce inflation to the 2% target. According to Chair Powell, this will occur “over time”. Our read is that over time really means someday. Continuing our theme we are introducing a new term – rolling inflation. This is a Bray Farm IA exclusive! Note this is not the 12-month rolling inflation measure rather a description of the general environment. Furthermore, we are wearing down on the overused “sticky inflation” characterization. We believe rolling inflation accurately captures the moment and suggests the Fed is leaving plenty of room (and uncertainty) to manage the bumpy road lower while signaling possible rate cuts starting this year. Markets cheered.
Noting the data in the tables below, Core Services (shelter and other) bounced around at higher levels while Core Goods bounced around at lower levels. According to Chair Powell comments, they expect that housing services and non-housing services will shift lower and goods prices will find equilibrium. Some combination of these three will produce lower inflation readings, but not on a straight line and with very uncertain timing i.e. rolling inflation. And now to top it off, cocoa inflation is out of control. The Bray Farm IA analyst team (Steven) has lowered earnings estimates and placed a “Sell” rating on Easter Bunny, Inc.
We at Bray Farm have a tough time seeing the Fed cut rates three times in 2024 given our views of ongoing rolling inflation. From a credit standpoint, fundamental conditions should remain stable as we navigate Fed uncertainty despite tight risk spreads in the corporate and high yield bond markets. Shorter duration (or barbell) positioning continues to make sense to us as we see some higher rate risk in the belly of the curve due to our rolling inflation view and positive signs in the economy. Note that recent Cap Goods and Durable Goods Orders readings surprised to the upside.
When navigating the skiff into the bay, keep an eye out for the rollers on the horizon as a signal for instability. While we see rollers on the horizon for inflation and rates, we are not convinced that seasickness will ensue in the near term for the economy.
“Keep rollin’, rollin’, rollin’
Though the streams are swollen
Keep them dogies rollin’ rawhide.”
The Fed’s announcement this past week sparked concern over 2024’s place in the economic cycle. Will inflation subside enough to lower rates by early spring? Will persistent high interest rates push the economy into a hard landing? Has the risk profile of fixed income securities changed? Our novel analytic process suggests that expectations of the fixed income market tend toward stability.
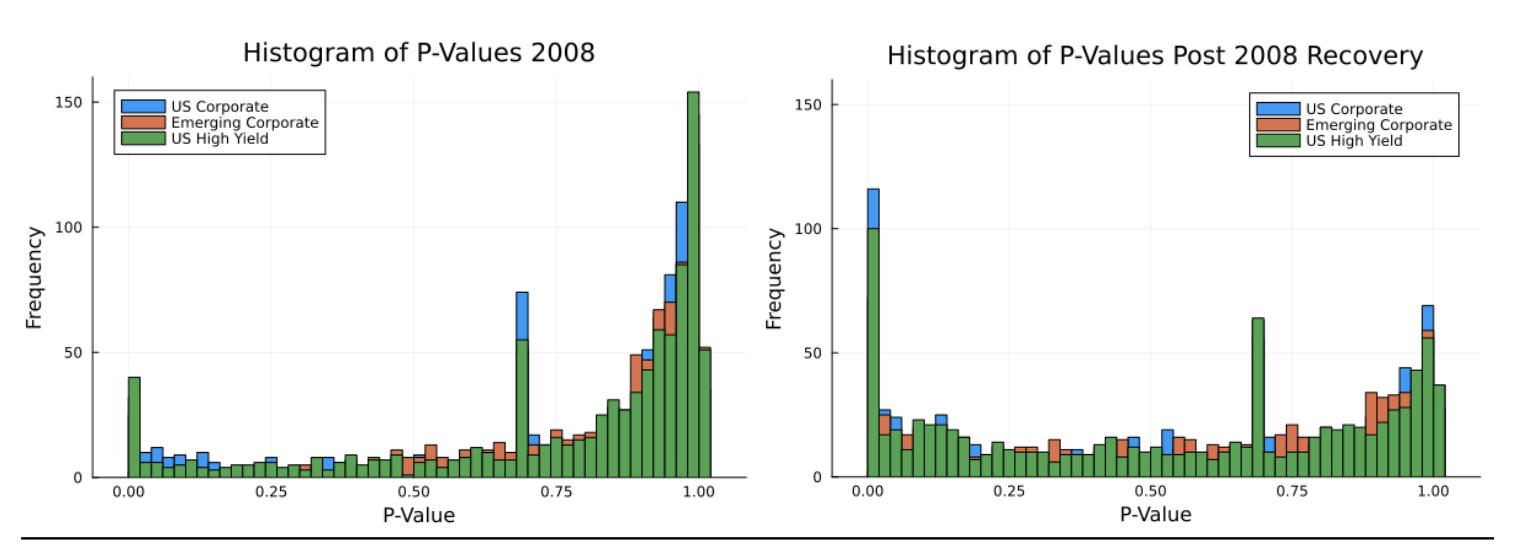
Our approach tested the stationarity of option adjusted spread and effective yield pre- and post-recession. Stationarity is a statical measure of continuity. If a metric is stationary, volatility is constant, and the metric’s value tends to regress to historical averages. A nonstationary metric sees dynamic changes in time with increased volatility and a departure from historic averages. Bray Farm IA’s method quantified this condition for the option adjusted spread (OAS) and effective yield for three fixed income indices— US Corporate, US High Yield, and Emerging Markets Corporate bonds (ICE Bank of America Indices).
The results of our study showed a significant difference in stationarity between pre- and post-recession economic conditions. Before a recession, the OAS and effective yield both display signs of dynamic volatility and a departure from expected values. After a recession or in bull markets, the OAS and yield see relative stability.
Results of our analysis pre (left) and post (right) 2008 Recession. Values clustered toward 1 indicate non-stationarity and changes in the economic regime. Values clustered toward 0 imply stability in volatility and value.
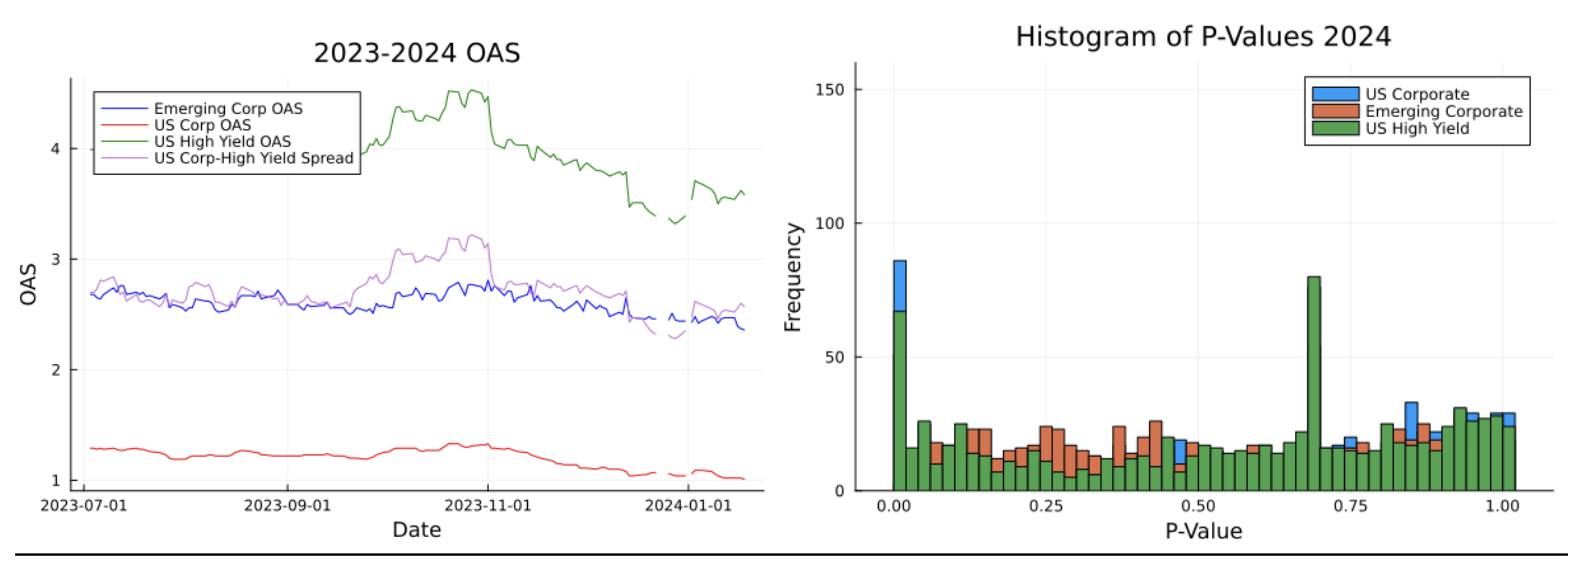
We applied our method to the last six months from present. The second half of 2023 more closely resembles a post-recession than pre-recession period. The market is presenting a stable expectation of credit risk. Investors have felt comfortable with risk levels and expect continuity. The OAS stationarity of 2023 indicates that investor perceive stability entering 2024. The question remains whether the continuing high-interest environment will drive fluctuations in the market risk regime. Early indicators suggest that OAS has not experienced major shocks from the announcement. The high-rate environment appears to be in line with market expectations from 2023. Macroeconomically, the factors pushing fixed-rate securities are stable, barring major shocks.
Raw data of OAS (left) and results of stationarity analysis (right). The analysis presents a clustering around the 0 value, suggesting stability. The spike at p = 0.70 is an artifact of the statistical technique and are not indicative of market behavior.