
Next week the Fed has its September meeting and will decide the next move for monetary policy. Markets are essentially – over 90% — certain that the FOMC will decide to cut the Federal Funds Rate by 25 basis points (bps), resuming the rate cut cycle started last fall. Since March 2023, the 2-year Treasury yield has remained below the effective federal funds rate — a historically reliable signal that markets anticipate lower policy rates.
On the long end of the curve, however, the effect of rate cuts is more ambiguous. Longer yields are a composite of policy rate trajectories and a term premium that reflects perceptions of duration risk, supply & demand dynamics, inflation expectations, and fiscal concerns. Generally, you’d expect rate cuts to lower the policy rate trajectory and thus lower the bond’s yield. But if the lower policy rate disproportionately increases medium term inflation expectations, the bond yield may rise.
After last September’s rate cut, the 10-year yield climbed 80 bps over the next two months. We need to ask: will the 10-year yield climb again after next week’s presumed rate cut?
We can start by disaggregating the changes in policy rate assumptions on the recent changes in the yield. We use the secured overnight financing rate (SOFR) Forward Curve to extract changing market expectations on the policy rate trajectory. Year to date, the 10-year yield has fallen 50 bps. Using principal component analysis, we found that changes in SOFR term forwards have decreased the 10-year yield by 38 bps. This number is the relative contribution of policy rate expectations to the yield.
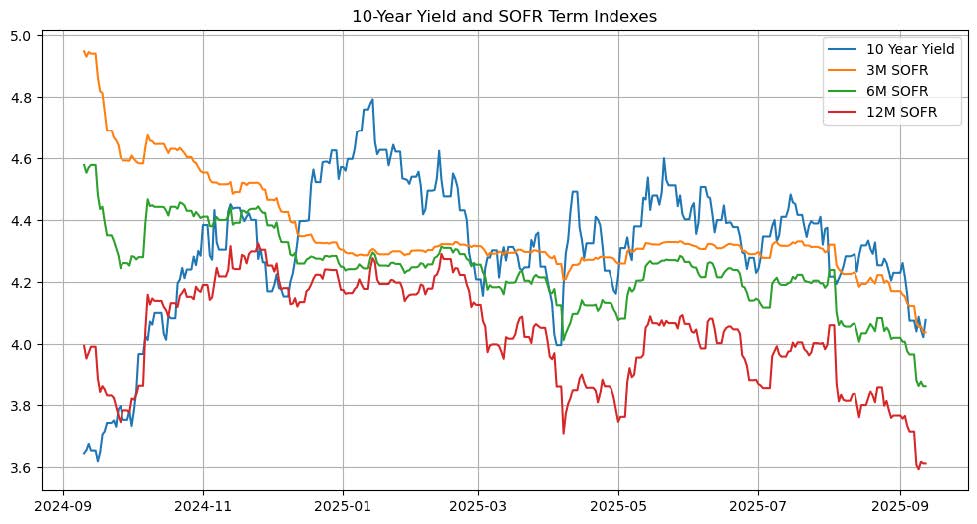
Data from Bloomberg
Next, we need to think about the term premium. The analysis from above implies that term premium compression has contributed 12 basis points to the overall change in the 10-year yield. We can look at relevant macro-factors to disaggregate market perceptions on inflation, global growth, and supply/demand.
Three simple, relevant factors are the dollar-yen exchange rate, oil prices, and 10-year breakeven rates. The yen is tied to US Treasury yields through a few vectors, like status as safe harbor assets, long-standing policy rate differentials, and trade-driven capital flows. Oil prices are a bellwether for macro conditions. Prices reflect changing global demand; increasing oil prices signal economic growth. Robust economic growth lowers the probability of future rate cuts, increasing yields. The 10-year breakeven is the anticipated inflation, equal to the difference between the 10-year yield and the yield on the 10-year
inflation adjusted bond (TIPS).
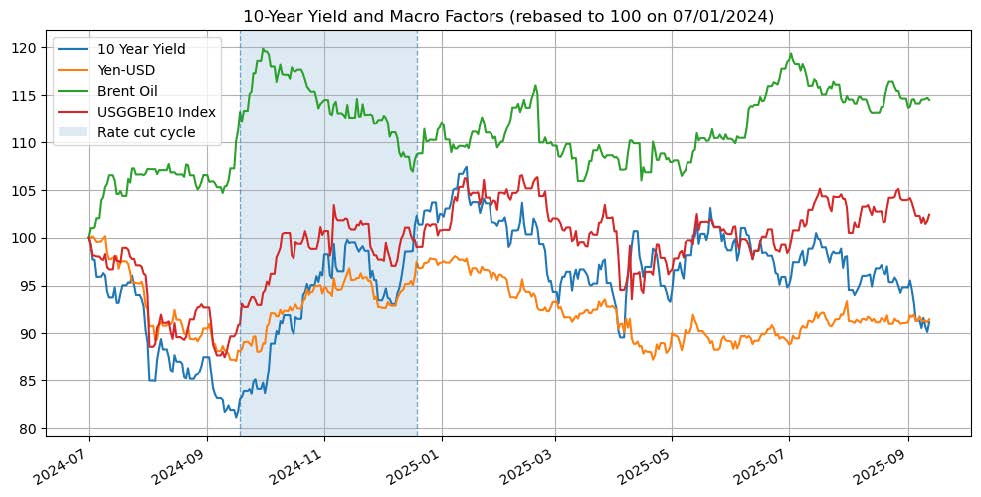
Data from Bloomberg
Last year’s rate cuts in September coincided with renewed climbs in oil prices and breakeven rates. The yen initially strengthened into the cut, then reversed once rate differentials began widening. A larger term premium, driven by sticky inflation expectations and strong oil demand, outweighed the mechanical effects of easier policy. Ahead of the upcoming rate cut, conditions look different.
Oil has fallen from its peak. Breakevens, though higher, are stable. Likewise, the yen appreciated early in 2025 and has stayed within a tight range since May. These signals and the year-to-date price action indicate that the 10-year is likely to remain within its current trading range.
However, there is a risk that the Fed’s guidance indicates a slower cut path than is priced in by the market. The market currently has priced in a trajectory to a terminal neutral rate that is 2 years earlier than the Fed’s own measure. If the dot plot shows only 2 cuts, the 12-month term SOFR may rise relative to the 3- and 6-month terms. If the entire curve shifts together – change in level – the 10-year is not affected, but a change in slope has an impact.
Unfortunately, these two conflicting factors balance each other out; the probability of the 10-year increasing is 50.2%. Though the direction of rates is ambiguous, we can focus on potential volatility. We forecast lower volatility than last year’s cycle. Our model projects less than 50 bps of change in the 10-year yield with a 95% confidence interval. However, if the Fed suggests a slower rate cut path, the 12-month SOFR term may rise relative to the 3- and 6-month terms. A 10 bps relative increase in the 12-month has a median change of +12 bps in the 10-year yield. All of this assumes no exogenous shocks such as geopolitical events or surprise changes in economic conditions.
Steven J. Wagner, Investment Adviser
Bray Farm Income Advisory LLC
3375 Brookdale Drive, Pittsburgh PA 15241
412.504.9412
412.848.2410 (cell)
The views stated in this letter are not necessarily the opinion of Cetera Advisors LLC. Due to volatility within the markets mentioned, opinions are subject to change without notice. Information is based on sources believed to be reliable; however, their accuracy or completeness cannot be guaranteed. Past performance does not guarantee future results.
Exchange-traded funds are sold only by prospectus. Please consider the investment objectives, risks, charges and expenses carefully before investing. The prospectus contains this and other information about the investment company, can be obtained from your financial professional at 412.504.9412. Be sure to read the prospectus carefully before deciding whether to invest.